See also Here = World Weather Online
Z, G.M.T, IR , UTC စေသာ အခ်ိန္ယူနစ္တို႔သည္ Universal Time Code/UTC ဂရင္းနစ္ စံေတာ္ခ်ိန္မ်ားျဖစ္သည္။ ျမန္မာစံေတာ္ခ်ိန္ႏွင္႔ ၆း၃၀ နာရီ ကြာသည္။ (+ ၆း၃၀ ) =========================================
Rain, Snow and Pressure Map

=======================================================
ယခု အပူခ်ိန္ ( တနာရီ တခါ ေျပာင္းသည္။)
Current Temperature
Continental Map depicting color contour isotherms, or lines of equal temperature in degrees Celsius. Major metropolitan cities also depicted along with prevailing weather icon. Data are updated hourly to indicate current conditions in Universal Time Code/UTC.

==========================================
Description: The Global Forecast Minimum Temperature image shows forecast low temperatures around the world, color contoured every 10 degrees C. Actual low temperatures in degrees F are given at selected cities. In physics, temperature is a physical property of a system that underlies the common notions of hot and cold; something that feels hotter generally has the higher temperature. Temperature is one of the principal parameters of thermodynamics. If no heat flow occurs between two objects, the objects have the same temperature; otherwise heat flows from the hotter object to the colder object.
ယေန႔အတြက္ အနိမ္႔ဆံုး အပူခ်ိန္ ခန္႔မွန္းခ်က္ ။ For today ,


=========================================
အျမင္႔ဆံုး အပူခ်ိန္ ျဖစ္နိုင္ေခ် ခန္႔မွန္းခ်က္ ( Maximum Temperature Forecast)
ယေန႔အတြက္ အျမင္႔ဆံုး အပူခ်ိန္ ခန္႔မွန္းခ်က္ ။
For today ,Description:The Global Forecast Maximum Temperature image shows forecast high temperatures around the world, color contoured every 10 degrees C. Actual high temperatures in degrees F are given at selected cities. In physics, temperature is a physical property of a system that underlies the common notions of hot and cold; something that feels hotter generally has the higher temperature. Temperature is one of the principal parameters of thermodynamics. If no heat flow occurs between two objects, the objects have the same temperature; otherwise heat flows from the hotter object to the colder object.


Description: The Global Sunshine image map shows where the sunniest conditions will exist around the word for the current day. Sunlight, in the broad sense, is the total spectrum of the electromagnetic radiation given off by the Sun. On Earth, sunlight is filtered through the atmosphere, and the solar radiation is obvious as daylight when the Sun is above the horizon. Near the poles in summer, the days are longer and the nights are shorter or non-existent. In the winter at the poles the nights are longer and for some periods of time, sunlight may not occur at all. When the direct radiation is not blocked by clouds, it is experienced as sunshine, a combination of bright light and heat.


======================================
ယေန႔
ေျမျပင္ေလ တိုကိခတ္မႈ Today Surface Wind
Direction

======================================================
မနက္ျဖန္ ခန္႔မွန္းခ်က္ ေျမျပင္ေလ
တိုက္ခတ္မႈ Tomorrow Surface Wind
Direction

----------------------------------------------------------------------------------------------------------
Current wind speeds in the jet stream ( 300 hPa ) . This colored contour map shows current wind speeds in the jet stream, which is typically found at altitudes where atmospheric pressure equals 300 hPa. Wind direction and magnitude is displayed by vector arrows. The jet stream images are updated twice per day, at approximately noon and midnight EST. http://maps.wunderground.com/data/640x480/2xa2_jt.gif
 ======================================================
ေလဖိအား
ႏွင္႕ အျမင္႕ေပ ဆက္စပ္မႈ ဇယား
Meteorology uses pressure as the
vertical coordinate and not height. This works out better for
thermodynamic computations that are done on a regular basis. Pressure
decreases in the atmosphere exponentially as height increases reaching
0 pressure in space. The standard unit of pressure is millibars (mb or
hectopascals-hPa) of which sea level is around 1015 mb. Standard
pressure levels and approximate heights
| Pressure | Approximate Height | Approximate Temp | ||
| Sea level | 0 m | 0 ft | 15 C | 59 F |
| 1000 mb | 100 m | 300 ft | 15 C | 59 F |
| 850 mb | 1500 m | 5000 ft | 5 C | 41 F |
| 700 mb | 3000 m | 10000 ft | -5 C | 23 F |
| 500 mb | 5000 m | 18000 ft | -20 C | -4 F |
| 300 mb | 9000 m | 30000 ft | -45 C | -49 F |
| 200 mb | 12000 m | 40000 ft | -55 C | -67 F |
| 100 mb | 16000 m | 53000 ft | -56 C | -69 F |
တိမ္
ကို သယ္ေဆာင္ေနေသာ ေလစီးေၾကာင္း မ်ားပံု Cloud Motion Wind

================================================
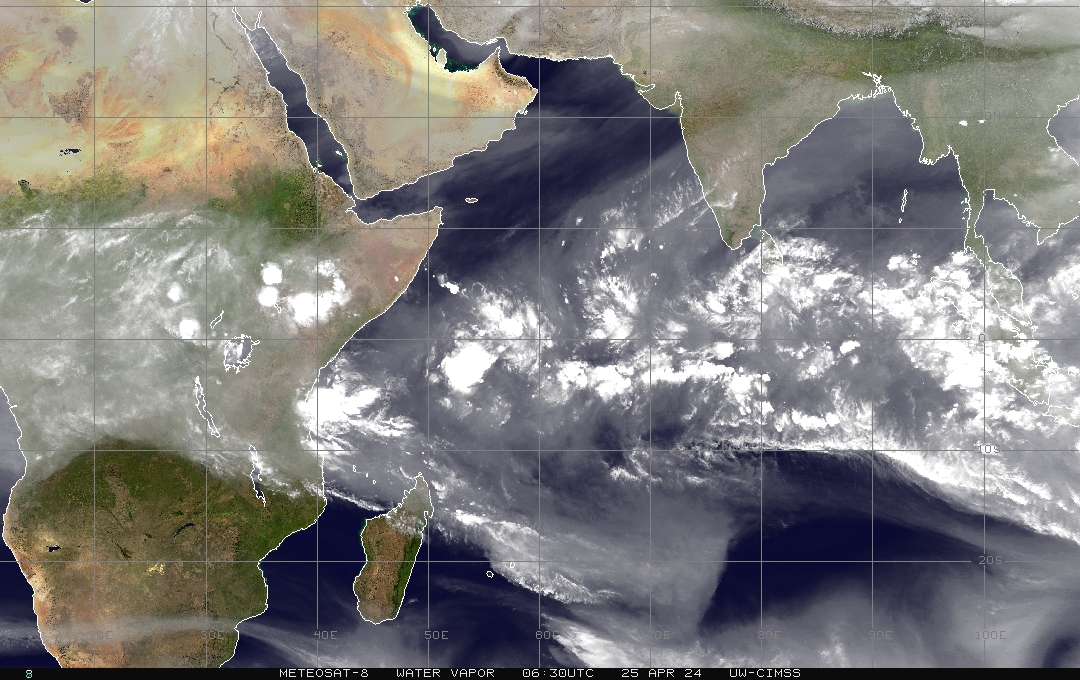
ေရေငြ႕မ်ား ကို သယ္ေဆာင္ေနေသာ ေလစီးေၾကာင္း မ်ားပံု Water VAPOUR Wind

===================================================
==========================================

=========================================
Current relative humidity / ေလထု စိုထိုင္းဆ
This colored contour map shows current relative humidity. Relative humidity is the ratio of water vapor contained in the air to the maximum amount of water vapor that can be contained in the air at the current temperature. The key below the image shows the corresponding relative humidity for each color.

==============================================
The Global Relative Humidity image

=======================================
Current dew point / ႏွင္းျဖစ္မွတ္
This colored contour map shows current dew point. Dew point is the temperature to which the air needs to be cooled in order for the relative humidity to reach 100%. This is also called the point of saturation, or when a cloud can form. The key below the image shows the corresponding dew point temperatures for each color.

========================================================
 ==========================================
Surface Analysis image ( synoptic )
Description: The Global Surface Analysis image shows current frontal, high, and low positions for sectors of the world. A surface weather analysis is a special type of weather map that provides a view of weather elements over a geographical area at a specified time based on information from ground-based weather stations. Weather maps are created by plotting or tracing the values of relevant quantities such as sea level pressure, temperature, and cloud cover onto a geographical map to help find synoptic scale features such as weather fronts.
For More , SEE Thai Weather Chat = http://www.tmd.go.th/en/weather_map.php
 ========================================

======================================================
Sea surface Temperature ပင္လယ္ေရ မ်က္ႏွာျပင္ အပူခ်ိန္


===================================================
Tropical Mercatar
 ======================================================
Infrared Satellite image
Description: The Global Infrared Satellite image shows clouds by their temperature. Red and blue areas indicate cold (high) cloud tops. Infrared (IR) radiation is electromagnetic radiation whose wavelength is longer than that of visible light, but shorter than that of terahertz radiation and microwaves. Weather satellites equipped with scanning radiometers produce thermal or infrared images which can then enable a trained analyst to determine cloud heights and types, to calculate land and surface water temperatures, and to locate ocean surface features.

-----------------------------------------------------------------------------------
 ==========================================
WIND SHEAR
 ==========================================
 =========================================
RELATIVE VORTICITY
Quick Look images are made from TRMM Microwave Imager (TMI) data.
Microwave brightness temperatures at 85.5 GHZ and at 37.0 GHZ are combined in the red, green and blue components (guns) of the images. See the table below for the meaning of colors. Water surfaces Dry atmosphere - blue moist atmosphere - dark blue Land surfaces Snow Cover - white/grey land (non-desert) - grey/brown Deserts - light green Other Surfaces Polar snow /ice - white/yellow Sea ice - green/brown Clouds/precipitation Scattering (by cloud ice) - yellow Emission (over water) - black
 ==================================================================
Current relative humidity / ေလထု စိုထိုင္းဆ
This colored contour map shows current relative humidity. Relative humidity is the ratio of water vapor contained in the air to the maximum amount of water vapor that can be contained in the air at the current temperature. The key below the image shows the corresponding relative humidity for each color.
==============================================
The Global Relative Humidity image
=======================================
Current dew point / ႏွင္းျဖစ္မွတ္
This colored contour map shows current dew point. Dew point is the temperature to which the air needs to be cooled in order for the relative humidity to reach 100%. This is also called the point of saturation, or when a cloud can form. The key below the image shows the corresponding dew point temperatures for each color.
========================================================
မိုးႀကီး နိုင္ေသာ ေနရာ မ်ား Heavy Rain
Forecast
==========================================Surface Analysis image ( synoptic )
Description: The Global Surface Analysis image shows current frontal, high, and low positions for sectors of the world. A surface weather analysis is a special type of weather map that provides a view of weather elements over a geographical area at a specified time based on information from ground-based weather stations. Weather maps are created by plotting or tracing the values of relevant quantities such as sea level pressure, temperature, and cloud cover onto a geographical map to help find synoptic scale features such as weather fronts.
For More , SEE Thai Weather Chat = http://www.tmd.go.th/en/weather_map.php
========================================
Cloud Top Temperature
======================================================
Sea surface Temperature ပင္လယ္ေရ မ်က္ႏွာျပင္ အပူခ်ိန္
===================================================
Tropical Mercatar
======================================================Infrared Satellite image
Description: The Global Infrared Satellite image shows clouds by their temperature. Red and blue areas indicate cold (high) cloud tops. Infrared (IR) radiation is electromagnetic radiation whose wavelength is longer than that of visible light, but shorter than that of terahertz radiation and microwaves. Weather satellites equipped with scanning radiometers produce thermal or infrared images which can then enable a trained analyst to determine cloud heights and types, to calculate land and surface water temperatures, and to locate ocean surface features.
-----------------------------------------------------------------------------------
==========================================WIND SHEAR
==========================================
Shear Tendency
(KTS) Over Past 24 Hour s:
Increasing & Decerasing
=========================================RELATIVE VORTICITY
=================================================
Quick Look images are made from TRMM Microwave Imager (TMI) data.
Microwave brightness temperatures at 85.5 GHZ and at 37.0 GHZ are combined in the red, green and blue components (guns) of the images. See the table below for the meaning of colors. Water surfaces Dry atmosphere - blue moist atmosphere - dark blue Land surfaces Snow Cover - white/grey land (non-desert) - grey/brown Deserts - light green Other Surfaces Polar snow /ice - white/yellow Sea ice - green/brown Clouds/precipitation Scattering (by cloud ice) - yellow Emission (over water) - black
==================================================================
No comments:
Post a Comment